The idea
Your baseline report answers one question: over the long run, what has this exact address actually had to deal with? Severity reads the slow-moving facts about your place, its track record and structure. It is not a live alarm, and it is not a single grade for how ready you are.
Reading it
Open BeAware, choose your address, then open its Baseline Risk Assessment. The header shows the address and a "Generated" date, because this is a snapshot we refresh on a cycle, not a feed that ticks in real time.
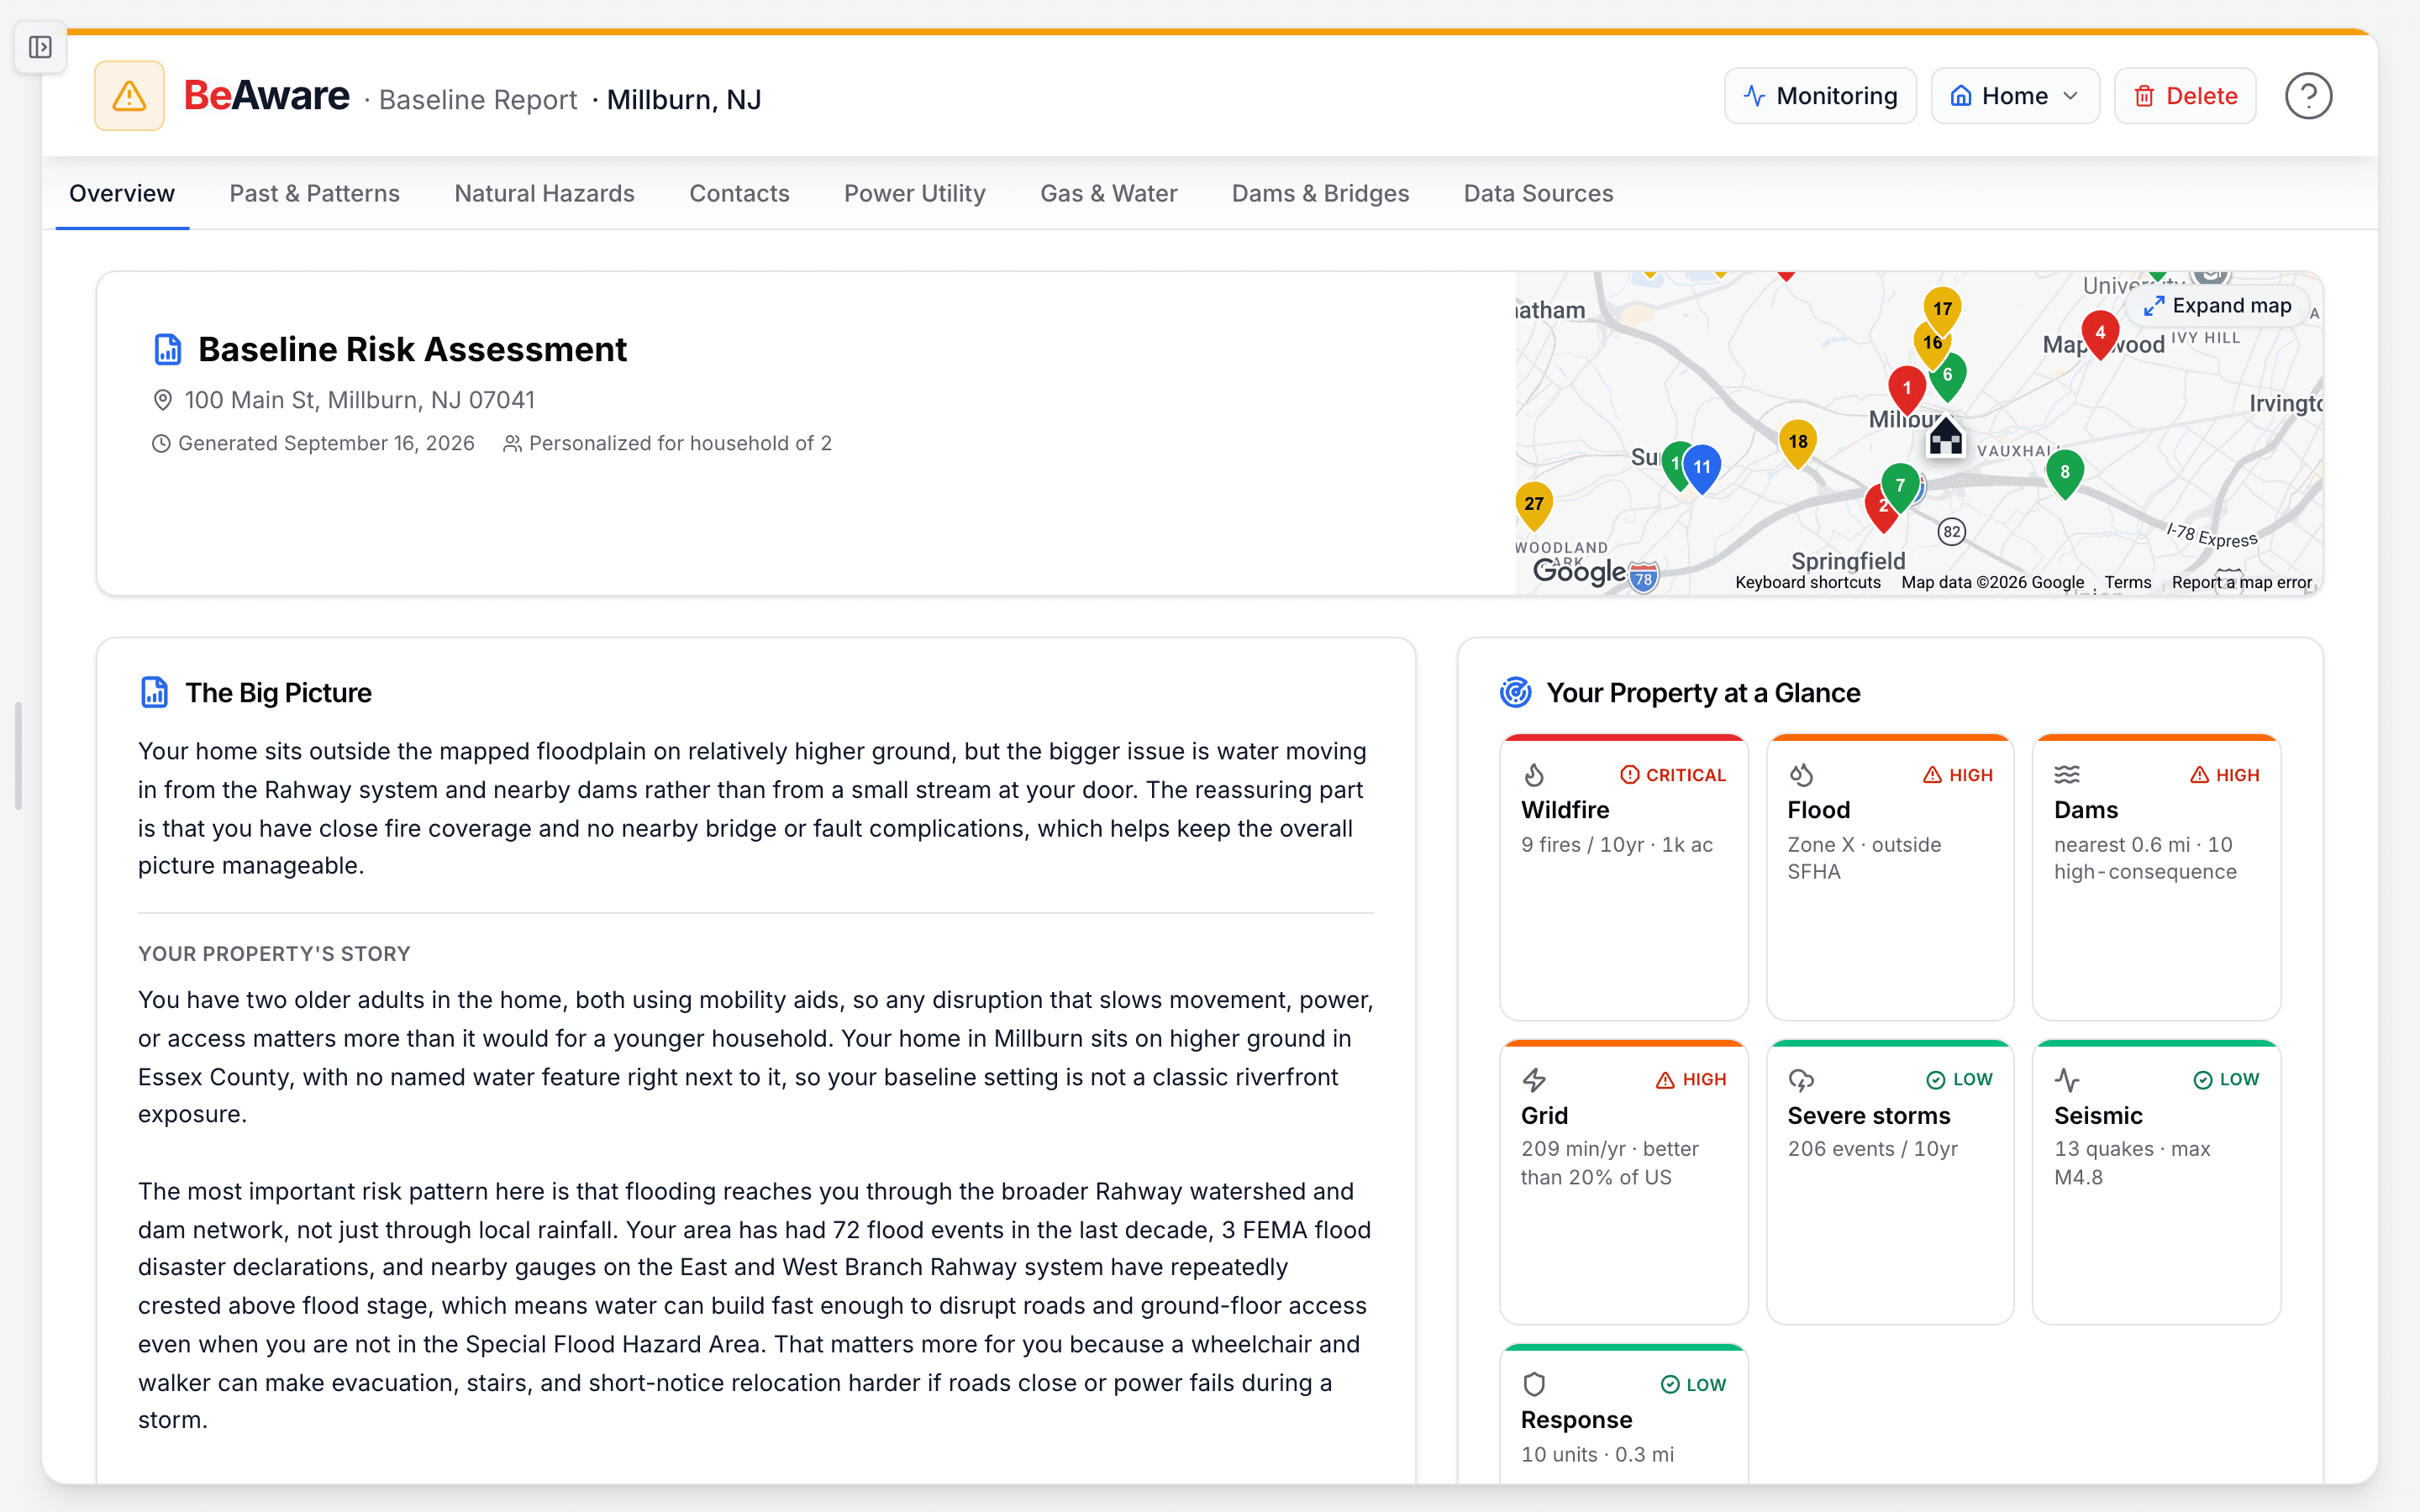
- Tap the map to explore the hazards around your home, or use Expand map for a bigger view.
- Start with "Your Property at a Glance." Each tile is one hazard domain, such as flood, wind and storms, wildfire, or air, with a severity label: Low, Elevated, High, or Critical. Severity is never color alone. Each tile also carries an icon and the word, so it reads the same in grayscale and for colorblind viewers. A tile can show "Unrated" when we do not have enough data to call it, which is honest rather than a fake zero.
- Read "The Big Picture" and "Your Property's Story." Two or three calm sentences name the one risk that matters most here, plus a grounding positive when the data supports it. This is the interpretation, the "so what" behind the tiles.
- Open "Risks Near You." Each hazard sits on a grid: how often it tends to happen (Rare, Occasional, Regular, Frequent) against how hard it hits (Minor, Moderate, Material, Catastrophic). Closer to the top right means more urgent. This is the core of per-hazard severity, and it is built from history. Tap a hazard to see its "Historical signal," the specific past event behind it, and the data sources we used.
- Skim "Key Insights" and the "Vulnerability Snapshot." Insights are cross-signal findings that combine two facts into one conclusion you might not have spotted. The snapshot breaks vulnerability into household, geographic, infrastructure, and environmental.
- Note "Risk Reality Check" when it appears. When our read of the record differs from the FEMA regulatory rating, we show both markers on one scale and list the evidence we weighed, such as disaster declarations, flood claims, and upstream high-hazard dams. It is there to interpret the paperwork, not to alarm you.
What the score is, and is not
- Per-hazard severity is a historical track record. It reflects what has happened at or near your address over the lookback window, weighted by how much a real event would affect this property. It is not a forecast for this week.
- There is a ZIP-level risk score, not a readiness grade. Your area carries a risk read drawn from the same structural and historical sources. On the Past and Patterns tab, you will also see how your storm-damage history compares with other U.S. counties.
- There is no resilience or readiness score. The baseline does not grade how prepared you are, and we removed that number on purpose. Preparedness belongs in your BeReady plan, where you can actually change it. The baseline tells you what you are working with. The plan is where you act.
How people actually use it
A family in a flood-claim-heavy ZIP opens the report and sees flood marked Elevated, even though FEMA puts them in a moderate zone. The "Risk Reality Check" shows why: several federal disaster declarations and flood claims on record nearby. They stop assuming they are fine on paper and add flood steps to their plan.
Someone in quiet inland terrain finds most tiles at Low, with severe summer storms the one Elevated item. Instead of vague worry, they now know the single thing to plan around, and the rest reads as calm confidence.
Where this fits
The baseline is the "Know your risk" step: slow-moving, historical, structural. Live changes like active outages, air quality, and river gauges live in the BeAware monitoring and Environmental views, kept separate so a historical report never reads as a live alert. Once you understand your severity, the next step is to turn it into action in your BeReady plan.