Where the month happened
Each numbered area is one of the stories below, drawn over the counties its warnings covered.
- Flash flooding in Texas, Sep 2–3
- Flash flooding in the Southwest, Sep 28–30
- Tornadoes and severe storms in the Mid-Atlantic, Sep 2–3
The same areas as a list
- 1. Flash flooding in Texas, September 2 to 3 · Water · 21 counties drawn
- 2. Flash flooding in the Southwest and Texas, September 28 to 30 · Water · 62 counties drawn
- 3. Tornadoes and severe storms in the Mid-Atlantic and Northeast, September 2 to 3 · Storms · 167 counties drawn
When it happened
- Fewer warnings
- More warnings
- Impact on people reported
View as a table
| Day | Warnings | Story on the map | Documented impact on people |
|---|---|---|---|
| Sep 1 | 661 | — | — |
| Sep 2 | 1,149 | 1, 3 | Yes |
| Sep 3 | 1,308 | 1, 3 | Yes |
| Sep 4 | 1,412 | — | — |
| Sep 5 | 1,103 | — | — |
| Sep 6 | 1,042 | — | — |
| Sep 7 | 913 | — | — |
| Sep 8 | 446 | — | — |
| Sep 9 | 605 | — | — |
| Sep 10 | 782 | — | — |
| Sep 11 | 714 | — | — |
| Sep 12 | 999 | — | — |
| Sep 13 | 745 | — | — |
| Sep 14 | 742 | — | — |
| Sep 15 | 807 | — | — |
| Sep 16 | 817 | — | — |
| Sep 17 | 694 | — | — |
| Sep 18 | 834 | — | — |
| Sep 19 | 1,069 | — | — |
| Sep 20 | 1,108 | — | — |
| Sep 21 | 1,292 | — | — |
| Sep 22 | 871 | — | — |
| Sep 23 | 611 | — | — |
| Sep 24 | 535 | — | — |
| Sep 25 | 595 | — | — |
| Sep 26 | 346 | — | — |
| Sep 27 | 370 | — | — |
| Sep 28 | 387 | 2 | Yes |
| Sep 29 | 669 | 2 | Yes |
| Sep 30 | 813 | 2 | Yes |
1Floodwater forced Livingston residents out by boat
SEP 1, 7 PM UTC
First warning
Jefferson County, Texas
SEP 1, 7 PM UTC
Considerable threat
Jefferson County, Texas
SEP 2, 10 AM UTC
Catastrophic threat
Hardin County, Texas
SEP 2, 10 AM UTC
Particularly dangerous
Hardin County, Texas
SEP 2, 10 AM UTC
Emergency declared
Hardin County, Texas
SEP 2, 3 PM UTC
County order
Hardin County, Texas
SEP 3, 1 AM UTC
Catastrophic threat
Hardin County, Texas
SEP 3, 1 AM UTC
Particularly dangerous
Hardin County, Texas
SEP 3, 1 AM UTC
Emergency declared
Hardin County, Texas
SEP 11, 2 AM UTC
Last warning
Hardin County, Texas
- Flash flooding — coloured as water. 21 counties in Texas, Sep 2–3.
In Livingston on September 2, emergency crews rescued a woman and four children from a flooded mobile home, KPRC reported. Crews also reached a family trapped near North Washington Avenue and East C Street. Elsewhere in the town, waist-high water left residents unable to leave safely on their own, and some departed by boat.
The warnings had begun the previous afternoon in Jefferson County, part of the southeast Texas flooding shown as 1 on the map. By dawn on September 2, the weather service in Lake Charles had declared a flash flood emergency in Hardin County. Its headline read: "FLASH FLOOD EMERGENCY FOR KOUNTZE, VILLAGE MILLS, HONEY ISLAND". Another emergency followed that evening in Hardin County as the flooding continued.
This is a PARTICULARLY DANGEROUS SITUATION. SEEK HIGHER GROUND NOW! Life threatening flash flooding of low water crossings, small creeks and streams, urban areas, highways, streets and underpasses.
In Indian Springs that day, blocked roads meant responders could not always drive to stranded neighbors. The volunteer fire chief reported more than 20 completely impassable roads, according to KPRC. "We have had to walk in places like a mile to check on people at this point", Chief Lindsay Phillips told the station. Volunteers cleared debris, helped drivers and connected some elderly residents to portable oxygen tanks while electricity was unavailable.
In Hardin County on September 2, game wardens helped evacuate 21 people from a damaged assisted-living facility, Texas Parks and Wildlife told the Associated Press. KFDM reported roughly 13,000 structures and customers still without electricity in the county. The Texas Department of Transportation closed southbound highway lanes because water covered the roadway and told people to avoid the area. County emergency officials also urged residents to limit travel while crews cleared roads and restored power.
By September 3, roads remained closed in Polk, Liberty and Hardin counties, ABC13 reported. Livingston schools also remained closed because of flooding and continuing power outages, according to FOX 26 Houston. No deaths or injuries were reported in the sources reviewed for this flooding. That finding does not erase the displacement or interrupted care: residents needed boats, accessible shelter and oxygen even after emergency messages had reached their communities.
Flood alerts by the numbers: every published month, by state and county.
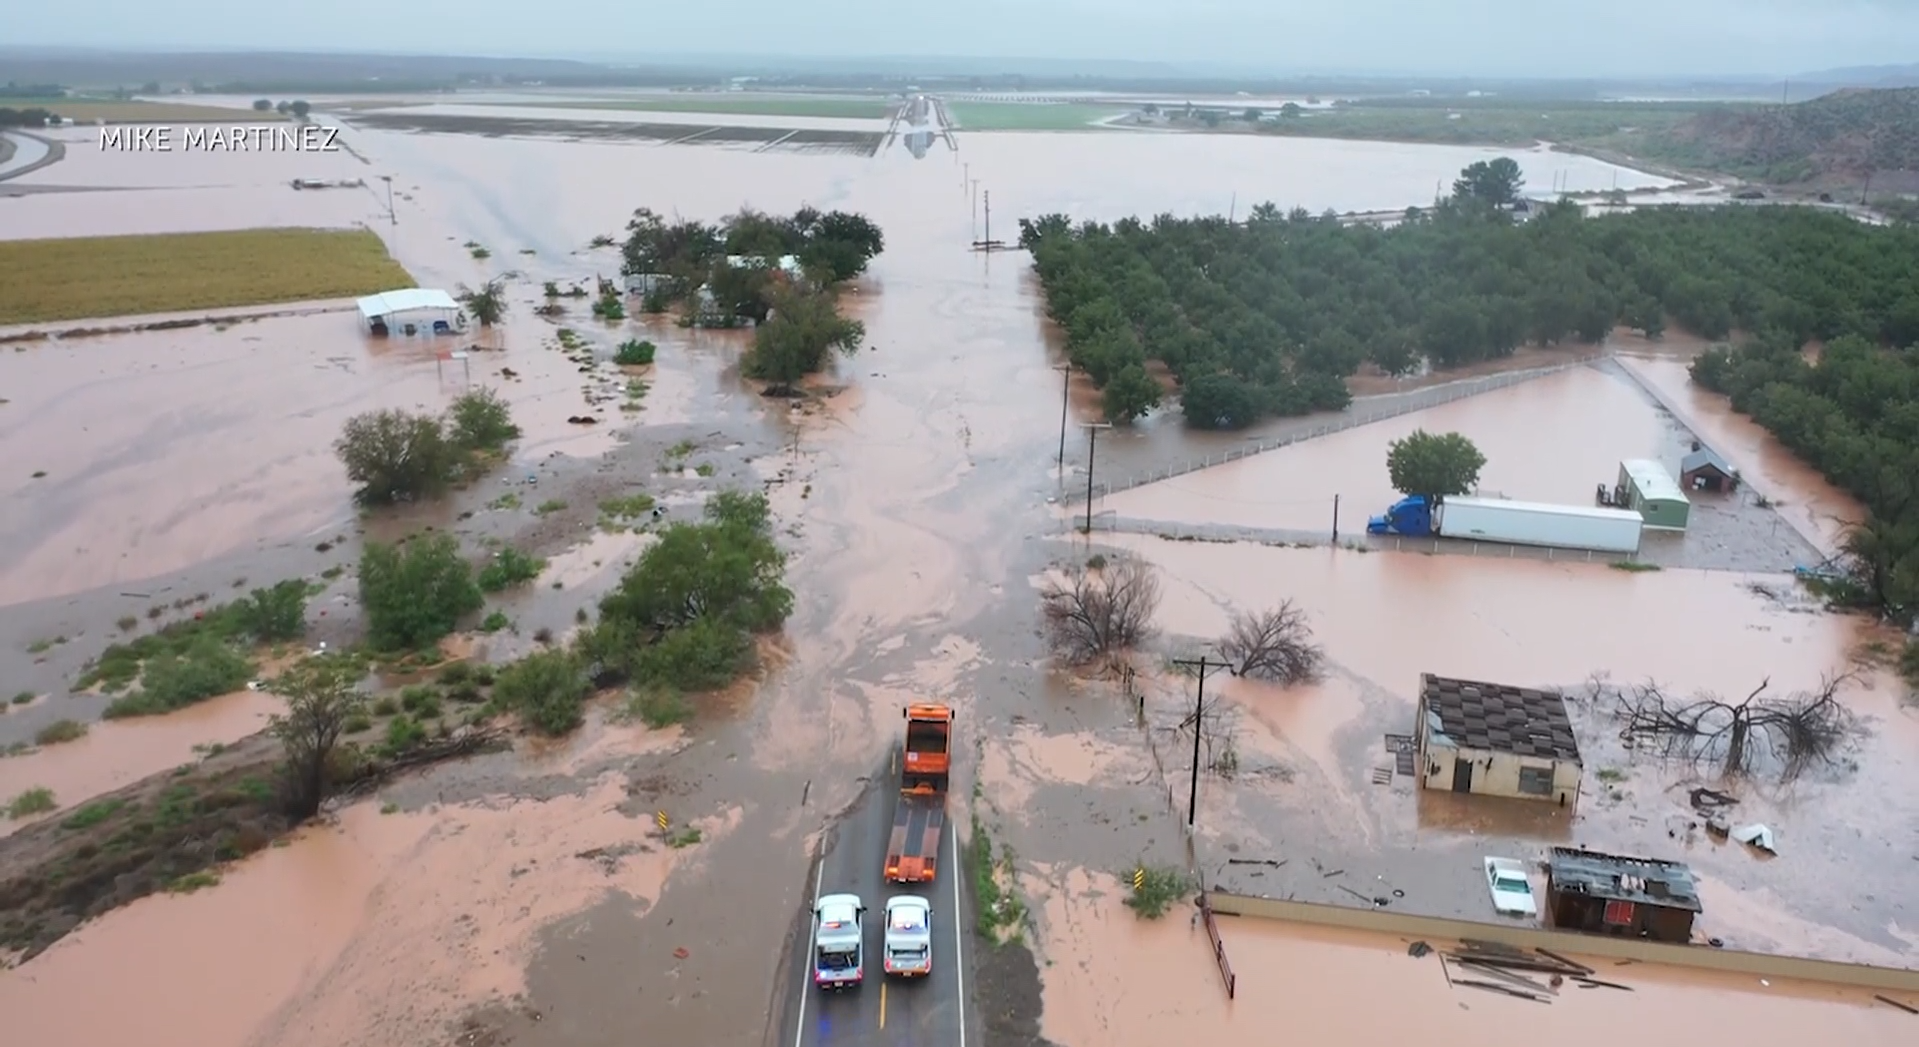
2Flooding threatened McLeod Dam and prompted southern New Mexico evacuations
SEP 28, 11 AM UTC
County order
Emery County, Utah
SEP 28, 7 PM UTC
First warning
Lincoln County, Nevada
SEP 28, 7 PM UTC
Considerable threat
Lincoln County, Nevada
SEP 28, 11 PM UTC
County order
Socorro County, New Mexico
SEP 29, 12 PM UTC
County order
Emery County, Utah
SEP 29, 7 PM UTC
Catastrophic threat
Doña Ana County, New Mexico
SEP 29, 7 PM UTC
Particularly dangerous
Doña Ana County, New Mexico
SEP 29, 7 PM UTC
Emergency declared
Doña Ana County, New Mexico
SEP 29, 10 PM UTC
Catastrophic threat
Doña Ana County, New Mexico
SEP 29, 10 PM UTC
Particularly dangerous
Doña Ana County, New Mexico
SEP 29, 10 PM UTC
Emergency declared
Doña Ana County, New Mexico
SEP 30, 12 AM UTC
Catastrophic threat
Doña Ana County, New Mexico
- Flash flooding — coloured as water. 62 counties in the Southwest, Sep 28–30.
At the Radium Springs Community Resource Center on September 29, approximately five to seven residents were staying at an evacuation shelter when KRWG interviewed the Red Cross. They had somewhere safe to spend the night while flooding threatened communities farther up the Hatch Valley. The shelter count described that location at that moment, not everyone who had left home.
The previous evening, Socorro County had told residents to shelter in place or evacuate to high ground. The danger then escalated in Doña Ana County, within the Southwest flooding marked 2 on the map. On the afternoon of September 29, the weather service in El Paso and Santa Teresa issued the headline "FLASH FLOOD EMERGENCY FOR MCLEOD DAM" after dam operators and county officials reported imminent failure. County emergency messages included the instruction "Evacuate Immediately". Further flash flood emergencies followed into the evening.
FLASH FLOOD EMERGENCY FOR X
The warning did not establish that the dam had collapsed. Later that day, a Doña Ana County spokesperson told the Albuquerque Journal that a small piping failure at McLeod Dam had been mitigated and pumps were being brought in to reduce pressure. The Weather Channel reported that hundreds of people in southern New Mexico had been ordered to evacuate, but it did not establish how many actually left. The order count and the Radium Springs shelter occupancy answered different questions.
Near Hatch, National Guard personnel and firefighters used a high-water vehicle to reach a woman trapped in her vehicle in an arroyo and took her to the fire station, KVIA reported on September 30. The Guard also assisted firefighters responding to a reported roof collapse at a Rincon home. Hatch Valley Public Schools canceled classes for that day, according to KVIA.
On the morning of September 30, Doña Ana County lifted Rincon's evacuation order after officials determined that the major flooding risk had subsided. Flooding, debris and damaged roads remained, the county cautioned. The Las Cruces Sun-News reported that no official reports of deaths or injuries from the southern New Mexico flooding were public by that morning. Permission to return did not mean the roads or homes were ready for ordinary use.
Flood alerts by the numbers: every published month, by state and county.
3Tornadoes damaged an East Shelby home and a Letchworth park pavilion
SEP 2, 12 PM UTC
First warning
Crawford County, Pennsylvania
SEP 2, 10 PM UTC
Tornado seen
Niagara County, New York
SEP 3, 12 PM UTC
Last warning
Allegheny County, Pennsylvania
- Tornadoes and severe storms — coloured as storms. 167 counties in the Mid-Atlantic, Sep 2–3.
In Shelby on September 2, resident Jim Foss watched the clouds abruptly change direction. "All of a sudden the clouds are going like this, turning left to right. Then all of a sudden it just switched real fast", he told Spectrum News 1. His account came from western New York, within the wider storm area marked 3 on the map, where surveyors would later trace tornado damage through residential streets and park grounds.
That morning, a tornado warning had gone out for Crawford County, Pennsylvania. By early evening, a warning in Niagara County, New York, described an observed tornado rather than rotation detected only by radar. At 6:07 p.m. local time, the Buffalo weather service reported that "a confirmed waterspout was located just offshore near Newfane" and was moving southeast.
At 607 PM EDT, a confirmed waterspout was located just offshore near Newfane, or 13 miles north of Lockport, moving southeast at 30 mph.
In East Shelby, the September 2 tornado caused significant tree damage at several residences along East Shelby Road and minor structural damage to a home, according to the National Weather Service's survey. Orleans County Emergency Management helped surveyors examine the damage the following day. The findings gave a street-level account of what the storm had done beyond the area named in the warning.
At Letchworth State Park, the tornado snapped or uprooted dozens of large trees along East Parade Grounds Road. Falling trees significantly damaged a large park pavilion, the weather service reported in its September 4 survey account. Livingston County emergency managers identified the worst damage locations and escorted surveyors through the heavily damaged eastern side of the park.
In Olcott, the September 2 tornado damaged trees along Main Street and near the Krull Park entrance, according to the Rochester Democrat and Chronicle. CNHI subsequently reported that county parks staff were cleaning up the park and emergency services personnel had supplied drone footage for the survey. The weather service reported no deaths or injuries from the East Shelby and Letchworth tornadoes. The Democrat and Chronicle reported no fatalities or injuries from the Olcott tornado. Those findings apply to the named tornadoes, not every community affected by the wider storms.
Tornado alerts by the numbers: every published month, by state and county.
How BePrepared monitors this, all year
This report exists because we already monitor the whole country. Every couple of minutes, around the clock, we read the emergency alerts going out across all fifty states and territories, and we keep them. A month of that record is what you have just read.
The national picture is the part most people never see. What matters to you is much smaller: which of these warnings would have reached your street, and what the risks around you look like on an ordinary day.
That is what BePrepared is for. Put in your ZIP code and you get the picture for where you live — the flood, fire and storm history around you, the dams and facilities nearby, and a plan for your household rather than a general one. With a free account you can keep a watchlist of the places you care about, like your home, your parents' address, and your kids' school, and set what you want to hear about.
Where it hit hardest
Counted as distinct warnings, and as the days a county spent under one. A county is the smallest area these warnings describe.
Warnings by region
- Southwest669
- Ohio Valley536
- Mid-Atlantic465
- Texas389
- Southeast347
Most days under a warning
- Jackson County, AR23 days
- Woodruff County, AR23 days
- Calhoun County, IL22 days
- Love County, OK21 days
- Craighead County, AR21 days
- Poinsett County, AR21 days
- Lawrence County, AR21 days
- Perry County, AR21 days
Where the warnings landed
- Extreme heat
- Flooding
- Severe storms
- Everything else
Extreme heat20,559 warnings · 1,785 counties
Flooding16,794 warnings · 1,763 counties
Severe storms14,677 warnings · 1,912 counties
Fire1,225 warnings · 201 counties
Tornadoes678 warnings · 214 counties
Safety & civil648 warnings · 360 counties
Hurricane & tropical313 warnings · 38 counties
Winter25 warnings · 13 counties
View as a table
| County | State | Warnings | Most frequent kind |
|---|---|---|---|
| Pima | AZ | 235 | Flooding |
| Meigs | OH | 187 | Flooding |
| Socorro | NM | 183 | Flooding |
| Lincoln | NM | 180 | Flooding |
| Otero | NM | 179 | Flooding |
| Athens | OH | 174 | Flooding |
| Doña Ana | NM | 167 | Flooding |
| Cochise | AZ | 163 | Flooding |
| Maricopa | AZ | 151 | Flooding |
| Washington | OH | 150 | Flooding |
| Jackson | WV | 144 | Flooding |
| Pinal | AZ | 142 | Flooding |
| Gallia | OH | 140 | Flooding |
| Vinton | OH | 139 | Flooding |
| Wood | WV | 133 | Flooding |
| Sierra | NM | 133 | Flooding |
| Sandoval | NM | 129 | Flooding |
| Gilmer | WV | 126 | Flooding |
| Mason | WV | 125 | Flooding |
| El Paso | TX | 124 | Flooding |
The human record
What it cost, and who reported it
These figures are not ours. Our archive records that a warning was issued, never what happened next, so every number here comes from the organization named beside it and was retrieved on October 1, 2026.
Toll
21people evacuated
Texas Parks and Wildlife reported that 21 people were evacuated from a damaged assisted-living facility in Hardin County, with game wardens assisting.
Source: Associated Press
ArchiveOur records place this event in Texas between 2026-09-02 and 2026-09-03.
Toll
No injuries reported at the time of the update
Hardin County officials reported no weather-related injuries at the time of their September 2 preliminary response update.
Source: KFDM
ArchiveOur records show flash flooding warnings covering this area on September 2.
Toll
No deaths or injuries reported in the department's service area
KPRC reported no deaths or injuries in the Indian Springs Volunteer Fire Department's service area at the time of its interview.
Source: KPRC 2 / Click2Houston
Displaced
Waist-high water in a Livingston neighborhood forced some residents to leave their homes by boat because they could not safely leave on their own.
Source: KPRC 2 / Click2Houston
Rescue
12motorists rescued
2residents rescued from a home
Hardin County responders rescued 12 motorists and pulled two residents from a flooded home.
Source: KFDM
Toll
The Las Cruces Sun-News reported that no official reports of injuries or deaths from the southern New Mexico flooding were public by the morning of September 30.
Source: Las Cruces Sun-News, republished by AOL
ArchiveOur records show flash flooding warnings covering this area on September 30.
Displaced
Hundreds of people ordered to evacuate
Hundreds of people in at least five southern New Mexico communities were ordered to evacuate as flooding threatened McLeod Dam, although the report did not provide a count of people who actually evacuated.
Source: The Weather Channel
ArchiveOur records place this event in New Mexico between 2026-09-28 and 2026-09-30.
Displaced
Approximately 5–7 residents at one shelter
KRWG reported approximately five to seven residents at the Radium Springs Community Resource Center evacuation shelter when its reporter interviewed the Red Cross on September 29.
Source: KRWG Public Media
Rescue
1woman rescued
National Guard personnel and firefighters used a high-water vehicle to rescue a woman trapped in her vehicle in an arroyo near Hatch and took her to the Hatch fire station.
Source: KVIA ABC-7
Rescue
At least1water rescue
Doña Ana County reported that at least one water rescue took place in the Rincon area on the morning of September 30.
Source: Doña Ana County
ArchiveOur records show flash flooding warnings covering this area on September 30.
Toll
0deaths
0injuries
The National Weather Service reported zero deaths and zero injuries from the September 2 tornado in East Shelby, southeast of Medina.
Source: National Weather Service Buffalo
ArchiveOur records show tornadoes and severe storms warnings covering this area on September 2.
Toll
0deaths
0injuries
The National Weather Service reported zero deaths and zero injuries from the September 2 Letchworth State Park tornado in Livingston County.
Source: National Weather Service Buffalo, archived by Iowa Environmental Mesonet
ArchiveOur records show tornadoes and severe storms warnings covering this area on September 2.
Toll
0deaths reported
0injuries reported
No fatalities or injuries were reported from the September 2 Olcott tornado associated with the storm that produced the waterspout near Newfane.
Source: Rochester Democrat and Chronicle / USA TODAY Network, republished by AOL
Rescue
Local fire companies responded to multiple water rescues in Clinton and Centre counties during the overnight September 2–3 storm, and the Centre County Water Rescue Task Force was activated.
In their words
Shelby resident Jim Foss described rapidly changing cloud movement during the September 2 storm to Spectrum News 1.
“All of a sudden the clouds are going like this, turning left to right. Then all of a sudden it just switched real fast”
Jim Foss, Shelby resident and storm eyewitness, to Spectrum News 1 Source: Spectrum News 1
For 3 of these stories, research looked for reported deaths and injuries and found none. As far as the record shows, no one was hurt.
The numbers behind this report
Every warning counted once, by type, place, day and hour, with the method below and the whole table downloadable at the end of the page.
What was warned about
| Alert type | Warnings | Messages |
|---|---|---|
| Severe Thunderstorm Warning | 5,682 | 5,683 |
| Special Weather Statement | 5,350 | 5,355 |
| Flash Flood Warning | 2,042 | 2,042 |
| Flood Advisory | 2,020 | 2,020 |
| Small Craft Advisory | 1,789 | 9,394 |
| Flood Warning | 987 | 1,286 |
| Heat Advisory | 887 | 1,370 |
| Special Marine Warning | 778 | 779 |
Where
| State | Warnings |
|---|---|
| TX | 1,710 |
| NM | 1,412 |
| OH | 1,063 |
| AZ | 1,037 |
| KS | 919 |
| NC | 835 |
| FL | 807 |
| CO | 791 |
The busiest hour of the period was 4pm local time, with 2,149 warnings.
Counties reached most often
| County | State | Warnings |
|---|---|---|
| Pima | AZ | 235 |
| Meigs | OH | 187 |
| Socorro | NM | 183 |
| Lincoln | NM | 180 |
| Otero | NM | 179 |
| Athens | OH | 174 |
| Doña Ana | NM | 167 |
| Cochise | AZ | 163 |
| Maricopa | AZ | 151 |
| Washington | OH | 150 |
A county with no alerts is not a county with no risk. It can mean a quiet period, or a hazard that this feed does not carry.
When the warnings arrived
View as a table
| Local hour | Warnings | Of which most severe |
|---|---|---|
| 12am | 631 | 5 |
| 1am | 599 | 11 |
| 2am | 683 | 2 |
| 3am | 574 | 3 |
| 4am | 520 | 3 |
| 5am | 453 | 5 |
| 6am | 484 | 5 |
| 7am | 478 | 11 |
| 8am | 499 | 16 |
| 9am | 599 | 6 |
| 10am | 601 | 10 |
| 11am | 759 | 12 |
| 12pm | 746 | 20 |
| 1pm | 1,073 | 20 |
| 2pm | 1,524 | 18 |
| 3pm | 1,890 | 36 |
| 4pm | 2,149 | 60 |
| 5pm | 2,092 | 46 |
| 6pm | 2,109 | 60 |
| 7pm | 1,765 | 96 |
| 8pm | 1,334 | 75 |
| 9pm | 1,092 | 30 |
| 10pm | 915 | 29 |
| 11pm | 870 | 9 |
The feed repeats itself
View as a table
| Stage | Count |
|---|---|
| Messages received | 39,067 |
| Of which updates | 19,432 |
| Of which cancels | 0 |
| Distinct warnings | 24,439 |
| Counties reached | 3,757 |
How severe they were
- Minor
- Moderate
- Severe
- Extreme
- Not classified
View as a table
| Severity | Warnings |
|---|---|
| Minor | 4,838 |
| Moderate | 7,731 |
| Severe | 11,125 |
| Extreme | 588 |
| Not classified | 157 |
What people were told to do
- Avoid
- Follow instructions
- Shelter
- Everything else
Where those instructions came from
- Shelter (6,018) — 1,463 corroborated as flood, 484 corroborated as tornado, 19 corroborated as wildfire, 4,052 with no hazard stated in the alert text
- Evacuate (25) — 8 corroborated as flood, 12 corroborated as wildfire, 5 with no hazard stated in the alert text
View as a table
| Response | Warnings | Share |
|---|---|---|
| Avoid | 8,638 | 35.3% |
| Follow instructions | 7,024 | 28.7% |
| Shelter | 6,018 | 24.6% |
| Monitor | 1,286 | 5.3% |
| Prepare | 1,204 | 4.9% |
| Unstated | 223 | 0.9% |
| Evacuate | 25 | 0.1% |
| All clear | 18 | 0.1% |
| No action | 3 | 0.0% |
What this report cannot tell you
- This report records the warnings that were sent: when, where, and what people were told to do. It cannot say whether anyone received them, whether they acted, or whether they had anywhere to go.
- Deaths, injuries, damage and acreage come from the news organizations and agencies named beside each figure. Our own records measure warnings, never outcomes, and are never the source for a toll.
- A county is the smallest area these alerts describe, so "a county was warned" does not mean every street in it was at risk.
- Where no figure has been reported, this report says so rather than estimating.
How these numbers were counted
Counted SEP 1, 2026 – OCT 1, 2026 · Frozen at publishThe alert figures in this report — how many warnings, where, when, and how severe — come from the alerts this archive received from FEMA IPAWS and the National Weather Service between September 1, 2026 and October 1, 2026, counted once and frozen when the report was published.
Deaths, damage and acreage are not ours and are never drawn from this archive. Each is attributed to the organization that reported it, above.
What was counted
- cap_status = 'Actual' (tests, exercises and demos excluded)
- SAME test codes RWT/RMT/DMO/NPT/NAT excluded, and any event type containing "test"
- An event is the first message of a CAP identifier chain; updates and cancels are counted separately
- Alert time is cap_sent, falling back to ingest time when the feed omits it
- Counties come from the alert geocodes (SAME/FIPS); statewide codes are not counted as counties
What these numbers cannot tell you
- Lead time is the gap between when an alert was sent and when it takes effect. This archive collapses CAP onset into effective, so for many products those are the same instant by design — it is not a measure of forecast warning time.
- 169 alerts expire exactly 24 hours after they were sent because the feed omitted an expiry and the ingest substitutes a default. They are excluded from the duration distribution rather than charted as real forecasts.
- Evacuation and shelter figures are RESPONSE counts. They record what people were told to do, not what caused it; where the alert text does not name a hazard, the row is reported as unstated.
- Hour-of-day figures use each alert’s own local time, resolved from its state. Alerts spanning several states resolve to the first state in their geocodes.
- National Weather Service alerts began arriving in volume on 2026-06-12. Earlier months hold only the handful that reached this archive by other routes, so they undercount weather alerts badly and cannot be compared with later months.
- Population figures are not available for these counties, so alert counts are reported per county and never per resident.
This archive
Collection began 2026-03-27. National Weather Service alerts began arriving in volume on 2026-06-12 (a small number reached the archive by other routes from 2026-03-31). Months from 2026-07-01 onward can be compared with each other; earlier ones cannot.
Photographs
The photos come from the reporting each story cites, or from public-domain and openly licensed collections. Each is credited as published and links to the page it came from; none belongs to BePrepared, and each is shown uncropped. To ask for a photo to be removed, write to support@bepreparedsolutions.co.
For newsrooms and researchers
Use these figures
Journalists, emergency managers and researchers are welcome to reuse anything in this report, including the underlying counts, with attribution. Version 1 of these figures is frozen: if a correction changes them, it appears above as a dated note rather than silently replacing what you cited.
BePreparedSolutions.co. "Floods displaced Texans and New Mexicans as tornadoes damaged western New York." Alert Pulse, October 1, 2026. https://bepreparedsolutions.co/reports/alert-pulse/2026-09
Source: BePrepared Solutions, Alert Pulse (2026). Alert counts from FEMA IPAWS and National Weather Service feeds; casualty and damage figures as attributed in the report.
<iframe src="https://bepreparedsolutions.co/reports/alert-pulse/2026-09/embed/reach_map" width="100%" height="520" style="border:0" loading="lazy" title="Floods displaced Texans and New Mexicans as tornadoes damaged western New York"></iframe>
The embed updates itself if we publish a correction, so it never goes stale the way a screenshot does.
The CSV carries the same frozen figures as this page, keyed to version 1.