Where the week happened
Each numbered area is one of the stories below, drawn over the counties its warnings covered.
- Coastal storm in New Jersey, Delaware and New York, Sep 22–27
The same areas as a list
- 1. Coastal storm in the Mid-Atlantic and Northeast, September 22 to 27 · Water · 18 counties drawn
When it happened
- Fewer warnings
- More warnings
- Impact on people reported
View as a table
| Day | Warnings | Story on the map | Documented impact on people |
|---|---|---|---|
| Sep 21 | 3 | — | — |
| Sep 22 | 4 | 1 | Yes |
| Sep 23 | 9 | 1 | Yes |
| Sep 24 | 9 | 1 | Yes |
| Sep 25 | 12 | 1 | Yes |
| Sep 26 | 13 | 1 | Yes |
| Sep 27 | 15 | 1 | Yes |
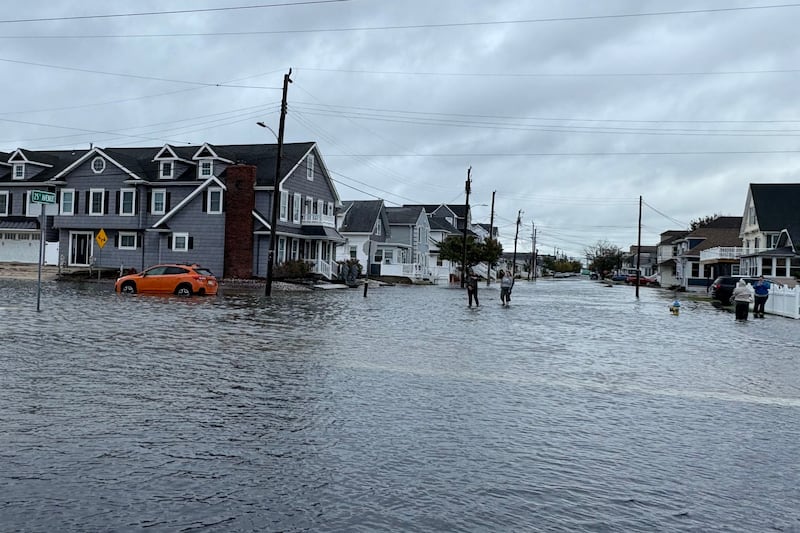
1Floodwater enters Jersey Shore homes and motels, forcing rescues
SEP 22, 4 PM EDT
First warning
Ocean County, New Jersey
SEP 27, 8 PM EDT
Last warning
Ocean County, New Jersey
- Coastal storm — coloured as water. 18 counties in New Jersey, Delaware and New York, Sep 22–27.
On Saturday in Egg Harbor Township, responders rescued nine adults and a dog from flooded rooms at the Travel Inn and New Sea Breeze motels, police told The Philadelphia Inquirer. In Atlantic City, crews also rescued trapped drivers, the newspaper reported. These were the immediate consequences of a coastal storm whose warnings had begun earlier in the week along the Jersey Shore, the area marked 1 on the map.
The first coastal flood warning for Ocean County went out Tuesday afternoon, forecasting inundation near shorelines and tidal waterways. By Friday, forecasts identified the weekend morning high tides as periods of concern. The governor’s office declared an emergency effective at 5 p.m. Friday in Ocean County and in Atlantic, Cape May and Monmouth counties. Manasquan recommended voluntary evacuation for residents of non-elevated buildings in low-lying, flood-prone areas, Star News Group reported. Some Ship Bottom residents evacuated on foot that day, according to WHYY.
For the Coastal Flood Advisory, up to one foot of inundation above ground level in low-lying areas near shorelines and tidal waterways. For the Coastal Flood Warning, one to two feet of inundation above ground level expected in low-lying…
On Saturday, emergency crews in Sea Bright rescued a woman and her dog from a vehicle in floodwater, according to ABC7 reporting cited by the Associated Press. Separately, Governor Mikie Sherrill said responders rescued dozens of people from homes and vehicles in the Atlantic City area that day, WHYY reported. That broader tally should not be added to the individual rescues. WHYY reported road closures in Ship Bottom and Sea Bright; Ocean City officials told the Inquirer that the morning high tide temporarily closed bridges into town. Monmouth County reported 2,500 residents without power that day and said restoration coordination was underway.
On Sunday, the weather service in Mount Holly warned, “Flooding caused by excessive rainfall is expected.” The Inquirer reported Sherrill’s account of severe dune loss in Atlantic City and Brigantine. Wildwood’s mayor told the newspaper that flooding contributed to multiple fires after water poured over bulkheads Saturday morning. WHYY reported on September 27 that no New Jersey deaths had been reported; the wider reporting reviewed for this story also contained no reports of injuries.
In Cape May, the Lobster House remained closed because of flooding, the Inquirer reported Sunday. Its owner said cleanup would require washing and disinfecting surfaces and replacing carpeting. For residents, even getting to work had required adjustments. Atlantic City resident Damere Kellum, a dispatcher at Atlantic City Linen Supply, told WHYY that flooded intersections forced him to change his scooter route Saturday: “It’s flooded all over there, so I had to come this way just to get to work.”
Flood alerts by the numbers: every published month, by state and county.
How BePrepared monitors this, all year
This report exists because we already monitor the whole country. Every couple of minutes, around the clock, we read the emergency alerts going out across all fifty states and territories, and we keep them. A month of that record is what you have just read.
The national picture is the part most people never see. What matters to you is much smaller: which of these warnings would have reached your street, and what the risks around you look like on an ordinary day.
That is what BePrepared is for. Put in your ZIP code and you get the picture for where you live — the flood, fire and storm history around you, the dams and facilities nearby, and a plan for your household rather than a general one. With a free account you can keep a watchlist of the places you care about, like your home, your parents' address, and your kids' school, and set what you want to hear about.
Where it hit hardest
Counted as distinct warnings, and as the days a county spent under one. A county is the smallest area these warnings describe.
Warnings by region
- Mid-Atlantic6
- Northeast1
Most days under a warning
- Ocean County, NJ7 days
- Atlantic County, NJ7 days
- Cape May County, NJ7 days
- Monmouth County, NJ7 days
- Burlington County, NJ7 days
- Middlesex County, NJ7 days
- Cumberland County, NJ7 days
- New Castle County, DE7 days
Where the warnings landed
- Flooding
- Everything else
Flooding93 warnings · 17 counties
View as a table
| County | State | Warnings | Most frequent kind |
|---|---|---|---|
| Ocean | NJ | 24 | Everything else |
| Cape May | NJ | 23 | Everything else |
| Atlantic | NJ | 23 | Everything else |
| Monmouth | NJ | 20 | Everything else |
| Hudson | NJ | 16 | Flooding |
| Essex | NJ | 16 | Flooding |
| Union | NJ | 16 | Flooding |
| Bergen | NJ | 12 | Flooding |
| Sussex | DE | 10 | Everything else |
| Richmond | NY | 10 | Flooding |
| New York | NY | 9 | Flooding |
| Burlington | NJ | 8 | Flooding |
| Passaic | NJ | 6 | Everything else |
| Middlesex | NJ | 6 | Flooding |
| New Castle | DE | 4 | Everything else |
| Salem | NJ | 4 | Everything else |
| 09001 | CT | 4 | Everything else |
| 09009 | CT | 4 | Everything else |
| Rockland | NY | 4 | Everything else |
| Westchester | NY | 4 | Everything else |
The human record
What it cost, and who reported it
These figures are not ours. Our archive records that a warning was issued, never what happened next, so every number here comes from the organization named beside it and was retrieved on September 28, 2026.
Toll
WHYY reported on September 27 that no deaths had been reported in New Jersey from the storm.
Source: WHYY
ArchiveOur records show coastal storm warnings covering this area on September 27.
Displaced
WHYY reported that some Ship Bottom residents evacuated on foot on September 25.
Source: WHYY
Rescue
9adults rescued
Egg Harbor Township police said nine adults and a dog were rescued from the Travel Inn and New Sea Breeze motels on September 26 after more than two feet of water entered first-floor rooms.
Source: The Philadelphia Inquirer
Rescue
dozens of people rescued
Governor Mikie Sherrill said responders rescued dozens of people after floodwaters two to three feet deep swept through homes and vehicles in the Atlantic City area on September 26.
Source: WHYY
Rescue
1person rescued
Emergency crews in Sea Bright rescued a woman and her dog from a vehicle trapped in floodwaters, according to ABC7 reporting cited by the Associated Press.
For one of these stories, research looked for reported deaths and injuries and found none. As far as the record shows, no one was hurt.
The numbers behind this report
Every warning counted once, by type, place, day and hour, with the method below and the whole table downloadable at the end of the page.
What was warned about
| Alert type | Warnings | Messages |
|---|---|---|
| Wind Advisory | 21 | 53 |
| Coastal Flood Warning | 12 | 89 |
| Rip Current Statement | 10 | 55 |
| Coastal Flood Statement | 7 | 8 |
| Coastal Flood Advisory | 6 | 75 |
| High Surf Advisory | 3 | 52 |
| Flood Warning | 3 | 3 |
| High Wind Warning | 2 | 10 |
Where
| State | Warnings |
|---|---|
| NJ | 47 |
| DE | 14 |
| CT | 4 |
The busiest hour of the period was 4am local time, with 10 warnings.
Counties reached most often
| County | State | Warnings |
|---|---|---|
| Ocean | NJ | 24 |
| Cape May | NJ | 23 |
| Atlantic | NJ | 23 |
| Monmouth | NJ | 20 |
| Hudson | NJ | 16 |
| Essex | NJ | 16 |
| Union | NJ | 16 |
| Bergen | NJ | 12 |
| Sussex | DE | 10 |
| Richmond | NY | 10 |
A county with no alerts is not a county with no risk. It can mean a quiet period, or a hazard that this feed does not carry.
When the warnings arrived
View as a table
| Local hour | Warnings | Of which most severe |
|---|---|---|
| 12am | 0 | 0 |
| 1am | 0 | 0 |
| 2am | 2 | 0 |
| 3am | 5 | 0 |
| 4am | 10 | 0 |
| 5am | 4 | 0 |
| 6am | 2 | 0 |
| 7am | 1 | 0 |
| 8am | 1 | 0 |
| 9am | 1 | 0 |
| 10am | 0 | 0 |
| 11am | 5 | 0 |
| 12pm | 2 | 0 |
| 1pm | 4 | 0 |
| 2pm | 5 | 0 |
| 3pm | 6 | 0 |
| 4pm | 7 | 0 |
| 5pm | 3 | 0 |
| 6pm | 3 | 0 |
| 7pm | 0 | 0 |
| 8pm | 0 | 0 |
| 9pm | 2 | 0 |
| 10pm | 1 | 0 |
| 11pm | 1 | 0 |
The feed repeats itself
View as a table
| Stage | Count |
|---|---|
| Messages received | 353 |
| Of which updates | 311 |
| Of which cancels | 0 |
| Distinct warnings | 65 |
| Counties reached | 46 |
How severe they were
- Minor
- Moderate
- Severe
View as a table
| Severity | Warnings |
|---|---|
| Minor | 16 |
| Moderate | 31 |
| Severe | 18 |
What people were told to do
- Avoid
- Follow instructions
- Monitor
- Everything else
View as a table
| Response | Warnings | Share |
|---|---|---|
| Avoid | 28 | 43.1% |
| Follow instructions | 21 | 32.3% |
| Monitor | 13 | 20.0% |
| Prepare | 3 | 4.6% |
What this report cannot tell you
- This report records the warnings that were sent: when, where, and what people were told to do. It cannot say whether anyone received them, whether they acted, or whether they had anywhere to go.
- Deaths, injuries, damage and acreage come from the news organizations and agencies named beside each figure. Our own records measure warnings, never outcomes, and are never the source for a toll.
- A county is the smallest area these alerts describe, so "a county was warned" does not mean every street in it was at risk.
- Where no figure has been reported, this report says so rather than estimating.
How these numbers were counted
Counted SEP 21, 2026 – SEP 28, 2026 · Frozen at publishThe alert figures in this report — how many warnings, where, when, and how severe — come from the alerts this archive received from FEMA IPAWS and the National Weather Service between September 21, 2026 and September 28, 2026, counted once and frozen when the report was published.
Deaths, damage and acreage are not ours and are never drawn from this archive. Each is attributed to the organization that reported it, above.
What was counted
- Only alerts covering at least one county in New Jersey. An alert warning several states is counted in each of them, so state editions do not sum to the national total.
- cap_status = 'Actual' (tests, exercises and demos excluded)
- SAME test codes RWT/RMT/DMO/NPT/NAT excluded, and any event type containing "test"
- An event is the first message of a CAP identifier chain; updates and cancels are counted separately
- Alert time is cap_sent, falling back to ingest time when the feed omits it
- Counties come from the alert geocodes (SAME/FIPS); statewide codes are not counted as counties
What these numbers cannot tell you
- Lead time is the gap between when an alert was sent and when it takes effect. This archive collapses CAP onset into effective, so for many products those are the same instant by design — it is not a measure of forecast warning time.
- 0 alerts expire exactly 24 hours after they were sent because the feed omitted an expiry and the ingest substitutes a default. They are excluded from the duration distribution rather than charted as real forecasts.
- Evacuation and shelter figures are RESPONSE counts. They record what people were told to do, not what caused it; where the alert text does not name a hazard, the row is reported as unstated.
- Hour-of-day figures use each alert’s own local time, resolved from its state. Alerts spanning several states resolve to the first state in their geocodes.
- National Weather Service alerts began arriving in volume on 2026-06-12. Earlier months hold only the handful that reached this archive by other routes, so they undercount weather alerts badly and cannot be compared with later months.
- Population figures are not available for these counties, so alert counts are reported per county and never per resident.
This archive
Collection began 2026-03-27. National Weather Service alerts began arriving in volume on 2026-06-12 (a small number reached the archive by other routes from 2026-03-31). Months from 2026-07-01 onward can be compared with each other; earlier ones cannot.
Photographs
The photos come from the reporting each story cites, or from public-domain and openly licensed collections. Each is credited as published and links to the page it came from; none belongs to BePrepared, and each is shown uncropped. To ask for a photo to be removed, write to support@bepreparedsolutions.co.
For newsrooms and researchers
Use these figures
Journalists, emergency managers and researchers are welcome to reuse anything in this report, including the underlying counts, with attribution. Version 2 of these figures is frozen: if a correction changes them, it appears above as a dated note rather than silently replacing what you cited.
BePreparedSolutions.co. "Jersey Shore flooding forces motel rescues and closes roads." Alert Pulse, September 28, 2026. https://bepreparedsolutions.co/reports/alert-pulse/nj-week-2026-09-21
Source: BePrepared Solutions, Alert Pulse (2026). Alert counts from FEMA IPAWS and National Weather Service feeds; casualty and damage figures as attributed in the report.
<iframe src="https://bepreparedsolutions.co/reports/alert-pulse/nj-week-2026-09-21/embed/reach_map" width="100%" height="520" style="border:0" loading="lazy" title="Jersey Shore flooding forces motel rescues and closes roads"></iframe>
The embed updates itself if we publish a correction, so it never goes stale the way a screenshot does.
The CSV carries the same frozen figures as this page, keyed to version 2.