Where the week happened
Each numbered area is one of the stories below, drawn over the counties its warnings covered.
- Tornadoes and severe storms in the Mid-Atlantic, Nov 12
- Severe storms in Indiana, Kentucky and Illinois, Nov 11–12
- Flash flooding in the Mid-Atlantic, Nov 12
- Winter storm in California and Nevada, Nov 12
The same areas as a list
- 1. Tornadoes and severe storms in the Mid-Atlantic and Northeast, November 12 · Storms · 20 counties drawn
- 2. Severe storms in the Midwest and Ohio Valley, November 11 to 12 · Storms · 34 counties drawn
- 3. Flash flooding in the Mid-Atlantic and Northeast, November 12 · Water · 13 counties drawn
- 4. Winter storm in California and Nevada, November 12 · Storms · 21 counties drawn
When it happened
- Fewer warnings
- More warnings
- Impact on people reported
View as a table
| Day | Warnings | Story on the map | Documented impact on people |
|---|---|---|---|
| Nov 9 | 288 | — | — |
| Nov 10 | 254 | — | — |
| Nov 11 | 333 | 2 | Yes |
| Nov 12 | 486 | 1, 2, 3, 4 | Yes |
| Nov 13 | 443 | — | — |
| Nov 14 | 362 | — | — |
| Nov 15 | 326 | — | — |
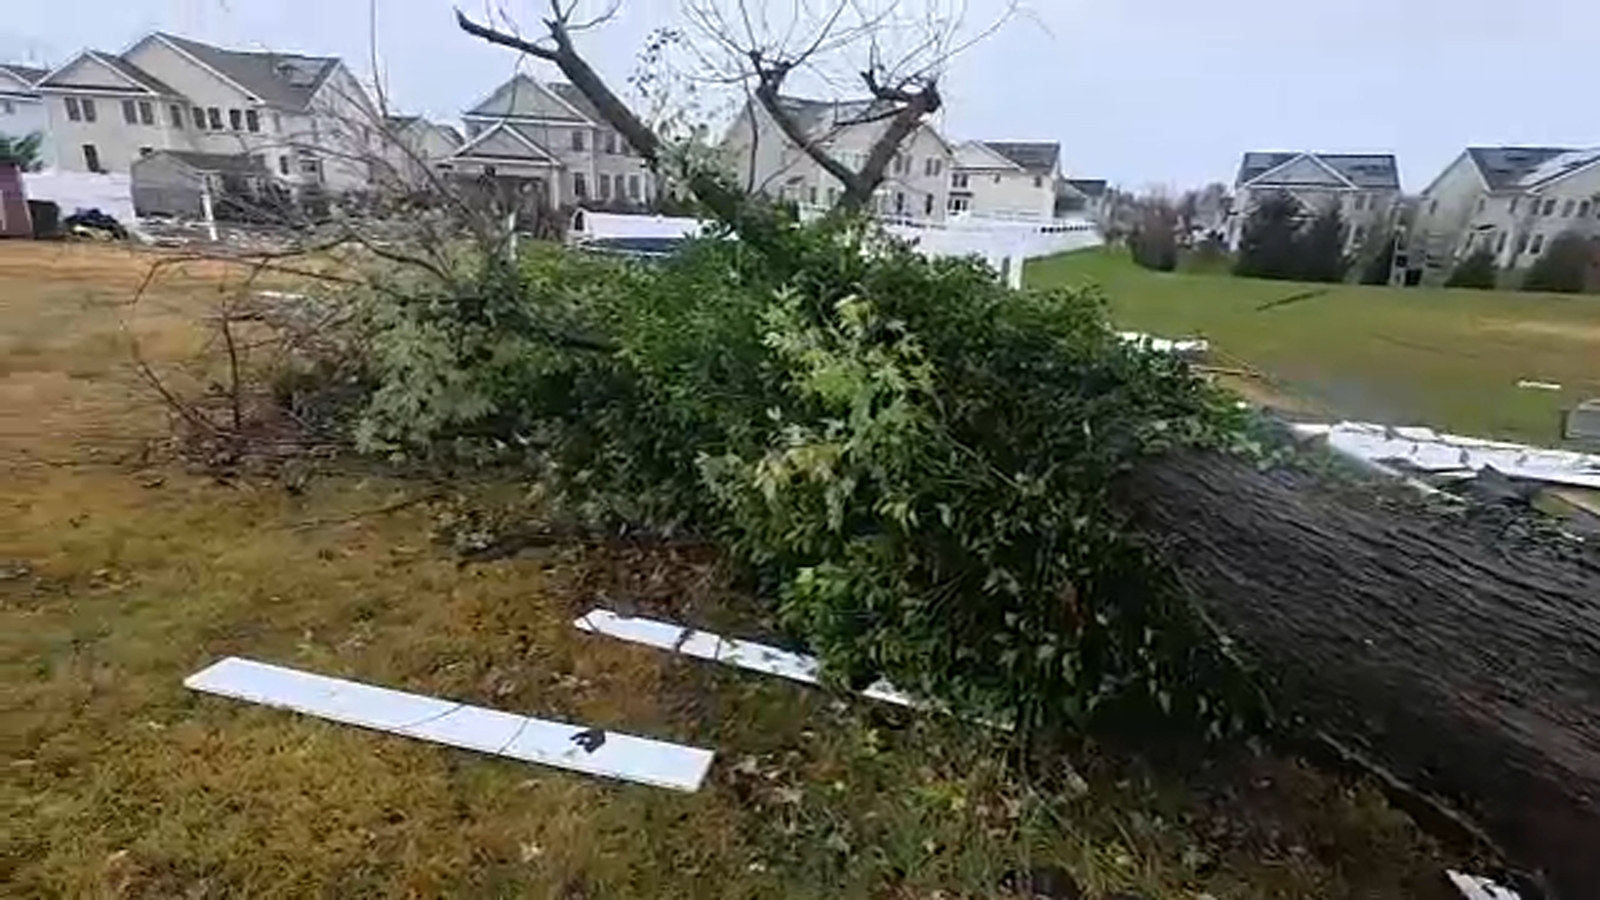
1Tornadoes damage homes in Newark and tear roofs in Chesterfield
NOV 12, 5 PM UTC
First warning
Cecil County, Maryland
NOV 12, 9 PM UTC
Tornado seen
Burlington County, New Jersey
NOV 12, 10 PM UTC
Last warning
Monmouth County, New Jersey
- Tornadoes and severe storms — coloured as storms. 20 counties in the Mid-Atlantic, Nov 12.
In Newark, Delaware, on November 12, hotel guest Theresa Badley watched a sign fall onto her parked car shortly before she would have entered it. “I was minutes from being inside of the car. Minutes,” she told 6abc / WPVI-TV. The station reported that the falling Sonesta ES Suites sign on Chapman Road totaled two cars.
Earlier that day, at 12:23 p.m. Eastern, the weather service issued a severe thunderstorm warning for Cecil County, Maryland. The storm corridor extended into Delaware and New Jersey (1 on the map). In Newark, the weather service’s subsequent survey documented damaged roofs and siding, windows blown out of Chapman Woods homes and an overturned semi-truck on the interstate.
People and animals outdoors will be injured. Expect hail damage to roofs, siding, windows, and vehicles. Wind damage to roofs, siding, trees, and power lines is possible.
By 4:03 p.m. Eastern, a Burlington County tornado warning described an observed tornado, rather than rotation indicated only by radar. “A rotating wall cloud was observed near Westampton Township in Burlington County,” the Mount Holly weather service wrote. In Chesterfield, its survey later documented collapsed barn walls, a home’s roof blown into neighboring yards and a school that lost part of its roof.
The last severe thunderstorm warning in Monmouth County ended at 5:56 p.m. Eastern. Burlington County emergency officials urged residents to avoid fallen wires and flooded streets, FOX 29 Philadelphia reported. NBC10 Philadelphia reported road closures while crews assessed damage, and 6abc reported that utility crews continued repairing Chesterfield poles and power lines the following day.
Mount Holly’s preliminary surveys recorded no deaths or injuries from the Newark tornado, the Chesterfield tornado or the separate nearby thunderstorm-wind damage. That is the documented finding, despite the damage to homes, vehicles and public facilities.
Tornado alerts by the numbers: every published month, by state and county.
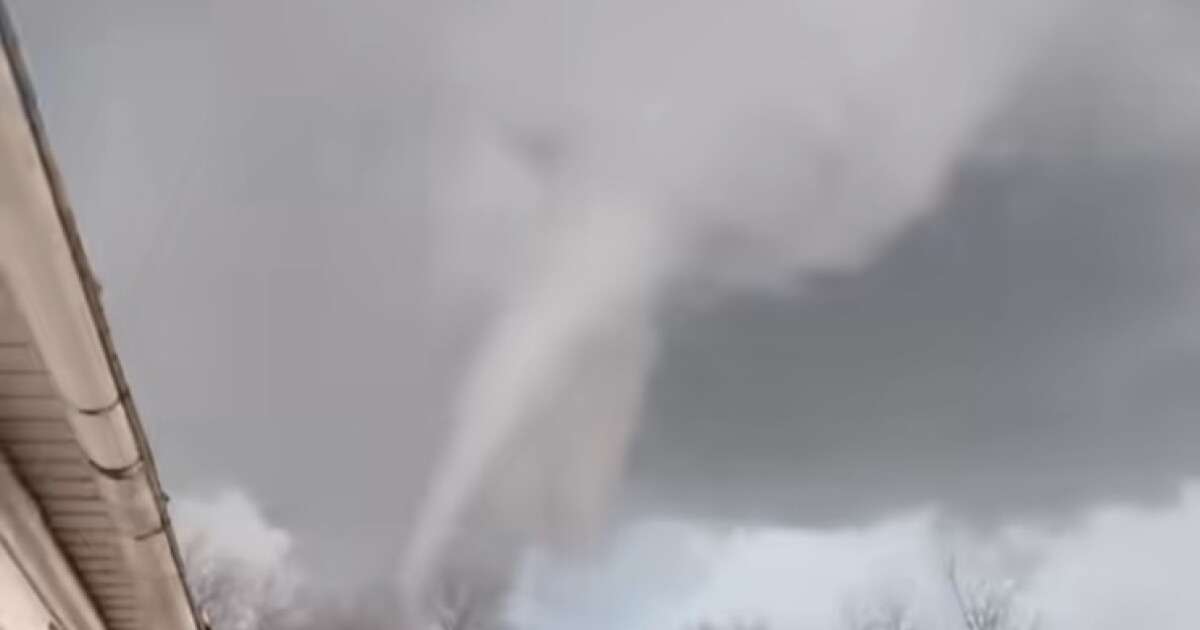
2A tornado near Riley, Indiana, damages homes and a barn
NOV 11, 9 PM UTC
First warning
Edwards County, Illinois
NOV 12, 3 AM UTC
Last warning
Barren County, Kentucky
- Severe storms — coloured as storms. 34 counties in Indiana, Kentucky and Illinois, Nov 11–12.
South of Riley, Indiana, on November 11, storms damaged home roofs and threw a partially damaged grain bin into nearby trees, according to the National Weather Service in Indianapolis. Its preliminary report also documented trees down in a roadway.
The regional warning sequence began at 3:56 p.m. Central in Edwards County, Illinois, before extending across southern Indiana and into Kentucky (2 on the map). Riley was among the towns named in the warnings, but the broader area under warning should not be mistaken for a continuous area of confirmed tornado damage.
Damage to vehicles is expected.
Farther south that evening, a warning covering Spencer and Warrick counties in Indiana and northeastern Daviess County in Kentucky directed people inside a well-built structure and away from windows, according to The Owensboro Times. “Damage to vehicles is expected,” the Paducah weather service warned in another message. The final severe thunderstorm warning ended in Barren County, Kentucky, at 9:30 p.m. Central.
On November 12, a weather service survey crew confirmed EF-0 tornado damage near Riley, WTHI-TV reported. WFIU / Indiana Public Media reported that the survey described storm-chaser video showing the tornado damaging a barn and pushing an RV off its foundation. Those were documented impacts, distinct from the hazards forecast across the wider region.
WFIU reported that no injuries had been reported after the Riley tornado. A review of weather service records and local coverage also found no reported deaths associated with this storm story.
Tornado alerts by the numbers: every published month, by state and county.
3Floodwater closes Route 35 lanes in Monmouth County
NOV 12, 4 PM UTC
First warning
Monmouth County, New Jersey
NOV 13, 2 AM UTC
Last warning
Monmouth County, New Jersey
- Flash flooding — coloured as water. 13 counties in the Mid-Atlantic, Nov 12.
In Middletown and Neptune City on November 12, floodwater closed Route 35 lanes in both directions. TNW Weather documented the Middletown closures around New Monmouth Road and south of Kings Highway. Edit USA reported the Neptune City closures north of Sylvania Avenue, citing the National Weather Service.
The first flash flood warning went out for Monmouth County at 11:45 a.m. Eastern. The flooding story extended west into the Philadelphia area (3 on the map), where warnings remained in effect into the evening. These messages concerned water across roads, separate from the day’s tornado damage.
In Philadelphia that day, flooding blocked the westbound Interstate 76 entrance ramp at Exit 342, serving Girard Avenue and the Philadelphia Zoo, according to Edit USA. The publication also relayed a weather service report of flooding across the interstate’s eastbound lanes elsewhere in the city.
At 6:51 p.m. Eastern, the weather service said heavy rain had ended and floodwaters had receded in the warning area around Philadelphia, according to Edit USA. It still advised people to heed remaining road closures. Monmouth County’s final flash flood warning ended at 9:50 p.m. Eastern, later than that improvement farther west.
A review of reporting by TNW Weather, Edit USA and other regional sources found no deaths or injuries reported for this flooding. The documented consequence was disrupted travel, including highway lanes and an entrance ramp that drivers could not use.
Flood alerts by the numbers: every published month, by state and county.
4Sonora Pass closes ahead of a Sierra winter storm
NOV 12, 7 AM UTC
First warning
Inyo County, California
NOV 16, 12 AM UTC
Last warning
Madera County, California
- Winter storm — coloured as storms. 21 counties in California and Nevada, Nov 12.
At Sonora Pass on November 12, Highway 108 closed ahead of the approaching winter storm. Outdoor Unc reported the closure, citing Caltrans and The Record-Courier. This was a precaution ahead of incoming weather, not evidence that the forecast snowfall had already arrived.
In Yosemite, officials scheduled Tioga Road to close at 5 p.m. Pacific that same day, with no reopening time announced, SFGATE reported. The planned closure added another travel restriction in the Sierra warning area (4 on the map).
Snow is expected for elevations above 6000 feet. Total snow accumulations up to a foot, with up to 2 feet at the highest peaks. Minor accumulations of around an 2 inch possible down to 5000 feet. Winds could gust as high as 60 mph.
Winter storm warnings had begun in Inyo County the previous evening. The Sacramento weather service warning issued on the closure day covered November 13 through November 14, according to the warning reproduced by GovOneStop. Its snow forecast therefore described the coming storm period, not observed conditions when the roads were closing.
For the coming Sierra storm, the Hanford weather service wrote: “Heavy snow expected. Widespread Moderate Impacts with total snow accumulations up to 16 inches. Winds gusting as high as 50 mph.” Those amounts and gusts were forecasts. The documented reporting establishes the road restrictions, not how much snow ultimately fell.
A review of weather service material and reporting by SFGATE, Outdoor Unc and other regional publications found no deaths or injuries reported for this story. The immediate effect on travelers was the loss of mountain routes before the forecast storm period began.
Winter weather alerts by the numbers: every published month, by state and county.
How BePrepared monitors this, all year
This report exists because we already monitor the whole country. Every couple of minutes, around the clock, we read the emergency alerts going out across all fifty states and territories, and we keep them. A month of that record is what you have just read.
The national picture is the part most people never see. What matters to you is much smaller: which of these warnings would have reached your street, and what the risks around you look like on an ordinary day.
That is what BePrepared is for. Put in your ZIP code and you get the picture for where you live — the flood, fire and storm history around you, the dams and facilities nearby, and a plan for your household rather than a general one. With a free account you can keep a watchlist of the places you care about, like your home, your parents' address, and your kids' school, and set what you want to hear about.
Where it hit hardest
Counted as distinct warnings, and as the days a county spent under one. A county is the smallest area these warnings describe.
Warnings by region
- Mid-Atlantic24
- Midwest19
- Texas15
- Ohio Valley10
- Southwest9
Most days under a warning
- Maricopa County, AZ7 days
- Lake County, FL7 days
- Volusia County, FL7 days
- Seminole County, FL7 days
- North Slope, AK7 days
- Brevard County, FL7 days
- DeSoto County, FL6 days
- Yuma County, AZ6 days
Where the warnings landed
- Winter
- Flooding
- Severe storms
- Everything else
Winter2,502 warnings · 515 counties
Flooding637 warnings · 152 counties
Severe storms437 warnings · 106 counties
Safety & civil175 warnings · 119 counties
Tornadoes43 warnings · 23 counties
View as a table
| County | State | Warnings | Most frequent kind |
|---|---|---|---|
| Volusia | FL | 28 | Flooding |
| Seminole | FL | 28 | Flooding |
| Tuolumne | CA | 28 | Winter |
| Tulare | CA | 27 | Winter |
| Lake | FL | 26 | Flooding |
| Humboldt | CA | 26 | Everything else |
| Del Norte | CA | 25 | Everything else |
| Placer | CA | 25 | Winter |
| Monmouth | NJ | 23 | Flooding |
| Guaynabo | PR | 22 | Everything else |
| San Juan | PR | 22 | Everything else |
| Trujillo Alto | PR | 22 | Everything else |
| 77275 | 22 | Everything else | |
| El Dorado | CA | 22 | Winter |
| Nevada | CA | 22 | Winter |
| San Diego | CA | 21 | Everything else |
| San Francisco | CA | 21 | Everything else |
| Anchorage | AK | 21 | Everything else |
| North Slope | AK | 21 | Winter |
| San Mateo | CA | 21 | Everything else |
The human record
What it cost, and who reported it
These figures are not ours. Our archive records that a warning was issued, never what happened next, so every number here comes from the organization named beside it and was retrieved on November 17, 2026.
Toll
0deaths
0injuries
The National Weather Service's preliminary survey recorded zero deaths and zero injuries from the November 12 Newark tornado in New Castle County.
Source: National Weather Service, Mount Holly
ArchiveOur records show tornadoes and severe storms warnings covering this area on November 12.
Toll
0deaths
0injuries
The National Weather Service's preliminary survey recorded zero deaths and zero injuries from both the Chesterfield tornado and the separate nearby thunderstorm-wind damage.
In their words
Theresa Badley told 6abc she watched the hotel sign fall onto her car shortly before she would have entered it.
“I was minutes from being inside of the car. Minutes.”
Theresa Badley, Hotel guest whose car was crushed by the falling sign, to 6abc / WPVI-TV Source: 6abc / WPVI-TV
In their words
Kushal Patel told 6abc that neighbors were helping one another clean up after homes and trees were damaged in Chapman Woods.
“And I think now everyone's just cleaning up, helping each other out.”
Kushal Patel, Person interviewed about the Chapman Woods neighborhood cleanup, to 6abc / WPVI-TV Source: 6abc / WPVI-TV
In their words
Chesterfield resident Tara McCreedy told 6abc that she sheltered in her basement with her family during the storm.
“In between 4 and 4:15 was when it was the worst. Pitch black, so loud. The hail was coming down.”
Tara McCreedy, Chesterfield resident who sheltered with her family, to 6abc / WPVI-TV Source: 6abc / WPVI-TV
Toll
WFIU reported that no injuries had been reported following the November 11 tornado near Riley, Indiana.
Source: WFIU / Indiana Public Media
ArchiveOur records show severe storms warnings covering this area on November 11.
Damage
3 to 4 homes with roof damage
The National Weather Service's preliminary storm report recorded roof damage to three to four homes two miles south of Riley during the November 11 storms.
Source: National Weather Service Indianapolis
ArchiveOur records show severe storms warnings covering this area on November 11.
Damage
1grain bin damaged
The National Weather Service reported that a grain bin was partially damaged and thrown into nearby trees two miles south of Riley on November 11.
Source: National Weather Service Indianapolis
ArchiveOur records show severe storms warnings covering this area on November 11.
Damage
The National Weather Service recorded trees downed in a roadway two miles south of Riley during the November 11 storms.
Source: National Weather Service Indianapolis
ArchiveOur records show severe storms warnings covering this area on November 11.
Damage
1 barn damaged and 1 RV pushed off its foundation
WFIU reported that the National Weather Service survey described storm-chaser video showing the November 11 tornado near Riley damaging a barn and pushing an RV off its foundation.
Source: WFIU / Indiana Public Media
ArchiveOur records show severe storms warnings covering this area on November 11.
Damage
On November 12, the National Weather Service reported flooding across all eastbound I-76 lanes near mile marker 347 in Philadelphia.
Source: Edit USA
Closed
On November 12, flooding closed all southbound Route 35 lanes at County Route 50 and New Monmouth Road and northbound lanes south of Kings Highway and Tindall Road in Middletown Township, Monmouth County.
Source: TNW Weather
ArchiveOur records show flash flooding warnings covering this area on November 12.
Closed
At 6:26 p.m. Eastern on November 12, the National Weather Service reported flooding that closed Route 35 lanes in both directions north of Sylvania Avenue in Neptune City, Monmouth County.
Source: Edit USA
ArchiveOur records show flash flooding warnings covering this area on November 12.
Closed
On November 12, flooding blocked the westbound I-76 entrance ramp at Exit 342 for Girard Avenue and the Philadelphia Zoo.
Source: Edit USA
Response
The National Weather Service issued a November 12 flash-flood warning through 7 p.m. Eastern for west-central Burlington County, northwestern Camden County, southeastern Montgomery County and central Philadelphia County.
Source: TNW Weather
ArchiveOur records show flash flooding warnings covering this area on November 12.
Closed
Highway 108 over Sonora Pass closed at noon on November 12, 2026, ahead of the approaching winter storm, according to Outdoor Unc's report citing Caltrans and The Record-Courier.
Source: Outdoor Unc
Closed
Yosemite National Park scheduled Tioga Road to close at 5 p.m. on November 12, 2026, ahead of incoming storms, with no reopening time announced.
Source: SFGATE
Response
The warning matching the supplied text was issued on November 12, 2026, but covered November 13 at 10 a.m. through November 14 at 10 a.m. PST, rather than snowfall occurring on November 12.
Source: National Weather Service Sacramento, reproduced by GovOneStop
For 4 of these stories, research looked for reported deaths and injuries and found none. As far as the record shows, no one was hurt.
The numbers behind this report
Every warning counted once, by type, place, day and hour, with the method below and the whole table downloadable at the end of the page.
What was warned about
| Alert type | Warnings | Messages |
|---|---|---|
| Small Craft Advisory | 603 | 3,409 |
| Special Weather Statement | 199 | 210 |
| Dense Fog Advisory | 157 | 217 |
| Wind Advisory | 136 | 344 |
| Flood Warning | 129 | 130 |
| Winter Weather Advisory | 126 | 245 |
| Severe Thunderstorm Warning | 116 | 116 |
| Gale Warning | 113 | 1,318 |
Where
| State | Warnings |
|---|---|
| CA | 232 |
| TX | 162 |
| AK | 131 |
| FL | 112 |
| IN | 88 |
| WA | 76 |
| KY | 57 |
| NJ | 56 |
The busiest hour of the period was 12pm local time, with 145 warnings.
Counties reached most often
| County | State | Warnings |
|---|---|---|
| Volusia | FL | 28 |
| Seminole | FL | 28 |
| Tuolumne | CA | 28 |
| Tulare | CA | 27 |
| Lake | FL | 26 |
| Humboldt | CA | 26 |
| Del Norte | CA | 25 |
| Placer | CA | 25 |
| Monmouth | NJ | 23 |
| Guaynabo | PR | 22 |
A county with no alerts is not a county with no risk. It can mean a quiet period, or a hazard that this feed does not carry.
When the warnings arrived
View as a table
| Local hour | Warnings | Of which most severe |
|---|---|---|
| 12am | 110 | 1 |
| 1am | 81 | 1 |
| 2am | 95 | 3 |
| 3am | 88 | 1 |
| 4am | 86 | 0 |
| 5am | 84 | 0 |
| 6am | 87 | 2 |
| 7am | 77 | 0 |
| 8am | 137 | 0 |
| 9am | 131 | 4 |
| 10am | 106 | 2 |
| 11am | 99 | 1 |
| 12pm | 145 | 2 |
| 1pm | 110 | 9 |
| 2pm | 100 | 3 |
| 3pm | 102 | 5 |
| 4pm | 98 | 3 |
| 5pm | 109 | 5 |
| 6pm | 107 | 3 |
| 7pm | 144 | 1 |
| 8pm | 131 | 4 |
| 9pm | 83 | 4 |
| 10pm | 89 | 0 |
| 11pm | 93 | 1 |
The feed repeats itself
View as a table
| Stage | Count |
|---|---|
| Messages received | 7,963 |
| Of which updates | 4,884 |
| Of which cancels | 0 |
| Distinct warnings | 2,492 |
| Counties reached | 2,073 |
How severe they were
- Minor
- Moderate
- Severe
- Extreme
- Not classified
View as a table
| Severity | Warnings |
|---|---|
| Minor | 910 |
| Moderate | 874 |
| Severe | 648 |
| Extreme | 55 |
| Not classified | 5 |
What people were told to do
- Avoid
- Follow instructions
- Prepare
- Everything else
Where those instructions came from
- Shelter (133) — 1 corroborated as flood, 50 corroborated as tornado, 82 with no hazard stated in the alert text
- Evacuate (2), 2 with no hazard stated in the alert text
View as a table
| Response | Warnings | Share |
|---|---|---|
| Avoid | 1,256 | 50.4% |
| Follow instructions | 704 | 28.3% |
| Prepare | 180 | 7.2% |
| Monitor | 148 | 5.9% |
| Shelter | 133 | 5.3% |
| Unstated | 65 | 2.6% |
| All clear | 4 | 0.2% |
| Evacuate | 2 | 0.1% |
What this report cannot tell you
- This report records the warnings that were sent: when, where, and what people were told to do. It cannot say whether anyone received them, whether they acted, or whether they had anywhere to go.
- Deaths, injuries, damage and acreage come from the news organizations and agencies named beside each figure. Our own records measure warnings, never outcomes, and are never the source for a toll.
- A county is the smallest area these alerts describe, so "a county was warned" does not mean every street in it was at risk.
- Where no figure has been reported, this report says so rather than estimating.
How these numbers were counted
Counted NOV 9, 2026 – NOV 16, 2026 · Frozen at publishThe alert figures in this report — how many warnings, where, when, and how severe — come from the alerts this archive received from FEMA IPAWS and the National Weather Service between November 9, 2026 and November 16, 2026, counted once and frozen when the report was published.
Deaths, damage and acreage are not ours and are never drawn from this archive. Each is attributed to the organization that reported it, above.
What was counted
- cap_status = 'Actual' (tests, exercises and demos excluded)
- SAME test codes RWT/RMT/DMO/NPT/NAT excluded, and any event type containing "test"
- An event is the first message of a CAP identifier chain; updates and cancels are counted separately
- Alert time is cap_sent, falling back to ingest time when the feed omits it
- Counties come from the alert geocodes (SAME/FIPS); statewide codes are not counted as counties
What these numbers cannot tell you
- Lead time is the gap between when an alert was sent and when it takes effect. This archive collapses CAP onset into effective, so for many products those are the same instant by design — it is not a measure of forecast warning time.
- 25 alerts expire exactly 24 hours after they were sent because the feed omitted an expiry and the ingest substitutes a default. They are excluded from the duration distribution rather than charted as real forecasts.
- Evacuation and shelter figures are RESPONSE counts. They record what people were told to do, not what caused it; where the alert text does not name a hazard, the row is reported as unstated.
- Hour-of-day figures use each alert’s own local time, resolved from its state. Alerts spanning several states resolve to the first state in their geocodes.
- National Weather Service alerts began arriving in volume on 2026-06-12. Earlier months hold only the handful that reached this archive by other routes, so they undercount weather alerts badly and cannot be compared with later months.
- Population figures are not available for these counties, so alert counts are reported per county and never per resident.
This archive
Collection began 2026-03-27. National Weather Service alerts began arriving in volume on 2026-06-12 (a small number reached the archive by other routes from 2026-03-31). Months from 2026-07-01 onward can be compared with each other; earlier ones cannot.
Photographs
The photos come from the reporting each story cites, or from public-domain and openly licensed collections. Each is credited as published and links to the page it came from; none belongs to BePrepared, and each is shown uncropped. To ask for a photo to be removed, write to support@bepreparedsolutions.co.
For newsrooms and researchers
Use these figures
Journalists, emergency managers and researchers are welcome to reuse anything in this report, including the underlying counts, with attribution. Version 1 of these figures is frozen: if a correction changes them, it appears above as a dated note rather than silently replacing what you cited.
BePreparedSolutions.co. "Tornadoes damage homes in Delaware, New Jersey and Indiana." Alert Pulse, November 17, 2026. https://bepreparedsolutions.co/reports/alert-pulse/week-2026-11-09
Source: BePrepared Solutions, Alert Pulse (2026). Alert counts from FEMA IPAWS and National Weather Service feeds; casualty and damage figures as attributed in the report.
<iframe src="https://bepreparedsolutions.co/reports/alert-pulse/week-2026-11-09/embed/reach_map" width="100%" height="520" style="border:0" loading="lazy" title="Tornadoes damage homes in Delaware, New Jersey and Indiana"></iframe>
The embed updates itself if we publish a correction, so it never goes stale the way a screenshot does.
The CSV carries the same frozen figures as this page, keyed to version 1.